Shallow Analysis of After Timeout Plays
Often times you hear that coaches are praised because of their ability to draw and execute After Timeout (ATO) Play, however, we’ll take a look if there is any correlation between the successful realization of ATO play and team’s win percentage. Furthermore, I’ll take a look at who are some of the most successful players in executing those same actions.
Data
The data is collected through the NBA’s Play by Play data. I found all the timeouts in this year’s season, which totaled up to 10905 timeouts. The goal after that was to find the next action. Here are all of the “next actions” that occurred, I filtered out the Substitutions:
- Missed Shots: 3927
- Made Shots: 3030
- Fouls: 1463
- Turnovers: 1106
- Free Throws: 1095
- Jump Ball: 100
- Violation: 71
- Timeout: 53
- End of Game: 31
- Offensive Foul: 29
As you can see, this is rather non-optimal data, we can filter out even more stuff here. So I also skipped Free Throws (because TO was called after foul/between free throws), Timeouts, Jump Balls (same as FTs), Violations (because that was some sort of delay of the game which didn’t affect the action), and classified Offensive Foul as Turnover (which it is). I simply removed End of Game actions, because I can’t really tell anything from them. The result of that is the following:
- Missed Shots: 4047
- Made Shots: 3121
- Turnovers: 1307
- Fouls: 1136
Team Success
The first thing I wanted to take a look at is how successful the teams are at these actions. To do so I took a look at Missed/made shots and turnovers to determine the success. I displayed the counts of these actions through a simple bar chart, seen on first image.
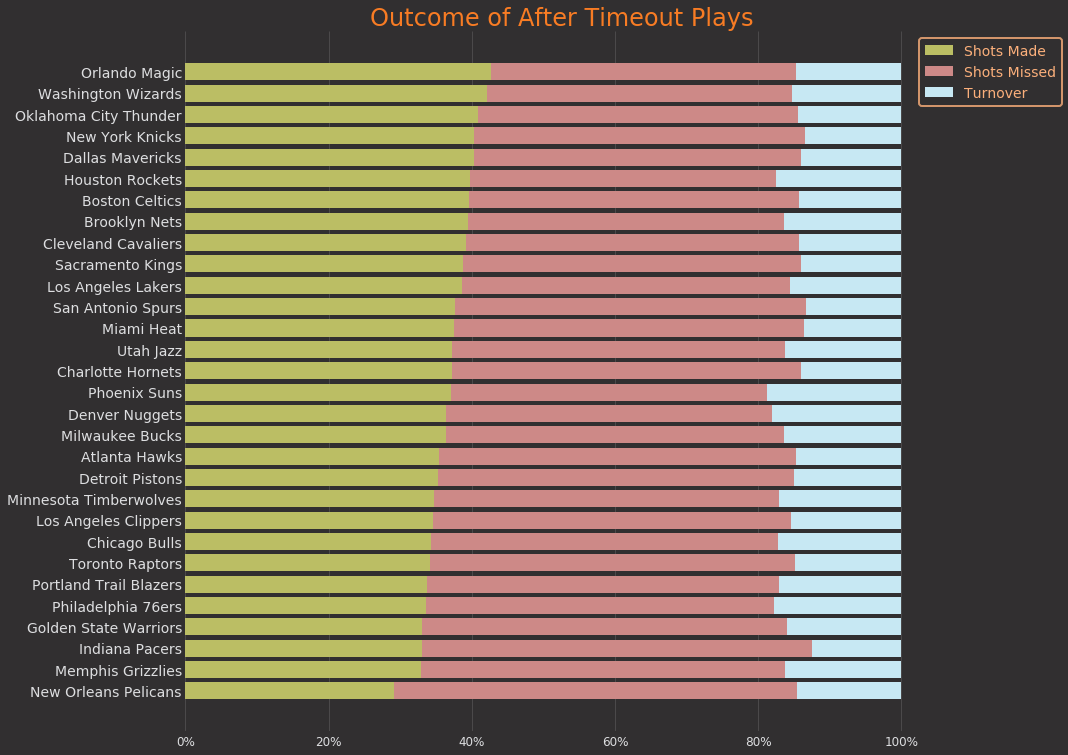
To my surprise, the Orlando Magic have been the most successful by far, followed by Wizards and Thunder. Knicks in fourth place are also rather surprising.
And Pelicans being almost last also comes as a bit of a surprise. They are dominantly last.
However all of the other numbers are relatively close, and no one really jumps out.
Does ATO success yield “better teams” (better Win%)?
No.
There is zero correlation between that, really, the r^2 value was almost zero, which means there is no positive or negative correlation.
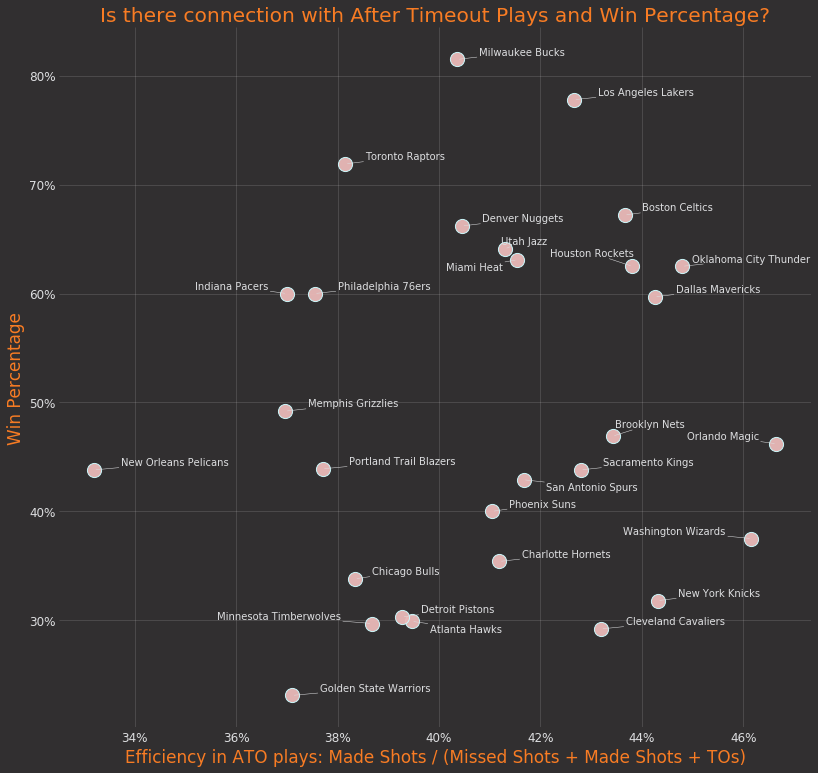
The second chart displays the success of ATO plays and Win Percentage. I defined the success of ATO plays as made shots / (made shots + missed shots + turnovers) .
By now you have probably figured out that I completely left out the Fouls (except offensive fouls, which I classified as TOs), the reason for that is that inferring whether that play was successful or not is rather complicated, and I didn’t really want to dive into that deep^(sorry).
Look at the most successful players
The general stars and leaders of the team popped up as the players which handle the most shots after the timeouts.
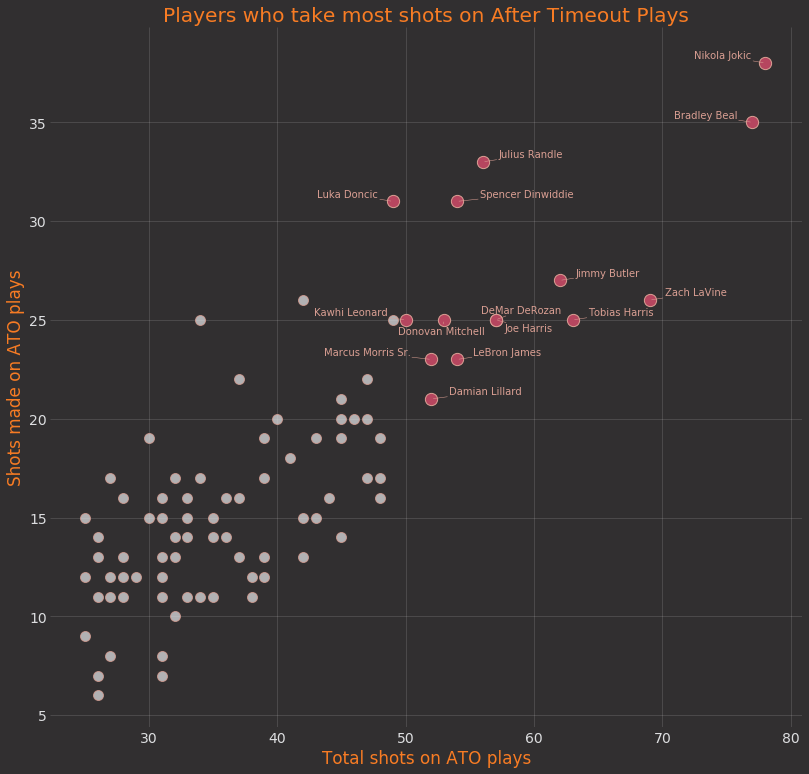
Previous chart is showing some of the players with most shots.
The surprises of this chart are Julius Randle, Marcus Morris, and Joe Harris to me. The first two are on Knicks, so I suppose they just isoed and drove/pulled up for a shot. Joe Harris, on the other hand, is a 3 point specialist, so that can be an interesting thing to check on video.
Dončić, Dinwiddie, and Randle again jump out as the most efficient guys in such actions as well. Jokić and Beal are the “workhorses” who take a bunch of shots in ATO plays.
Unassisted vs Assisted shots
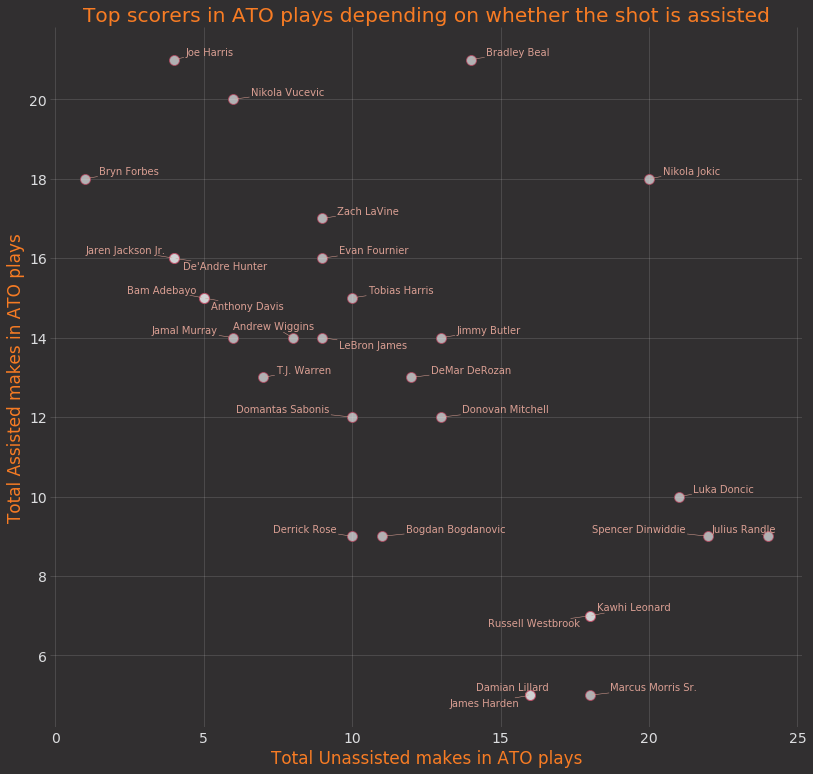
Last chart explains why Randle and Morris had both so many shots. They each created almost all of the made shots they scored (we can assume that they created the missed shots for themselves as well).
On the opposite side of the spectrum, there are Joe Harris and Bryn Forbes. They are in the upper left corner, in “the Land of the centers”. Both of them are 3 point specialists and this analysis shows they’re pretty good at it. I took a look at the plays called for Harris and a lot of those are drawn actions.
Double screens for him, screen by center and cut/screen by other guard which allow Harris to take the three.
Luka Dončić has also impressed me a lot, but his ATO style is opposite of Harris. Most of his shots are unassisted, he either drives to the hoop or pulls up from a step back. He creates his shots in really impressive way.
Conclusion
This was just a quick preview of After Timeout Plays, you can go deeper and deeper into it, and watch the video tape to generate some other conclusion. It would be really cool if there is a possibility to do one of the following stuff:
-
Check out the time left on the shot clock for each action (you can’t get that through play by play, because actions don’t always start at 24 seconds)
-
Check out whether the shots after Timeout are more “Wide Open” than usual shots
-
Check if a person takes more dribblees in their shots after timeout (would be interesting to see if Houston’s offense is Harden/Westbrook Iso even after timeouts, we can asssume that with current charts but this would confirm it)
-
And much more…