Who changed his shot profile the most this season?
At this point, most teams have played at least 15 games, which is already a pretty decent sample of games from which we can draw some conclusions. What interests me today is who changed their shot profile the most?
 Credit: Ringo H.W. Chiu / AP
Shot profile and dataset
The shot profile I’ll be talking about here only indicates the distribution of shots in individual zones on the floor.
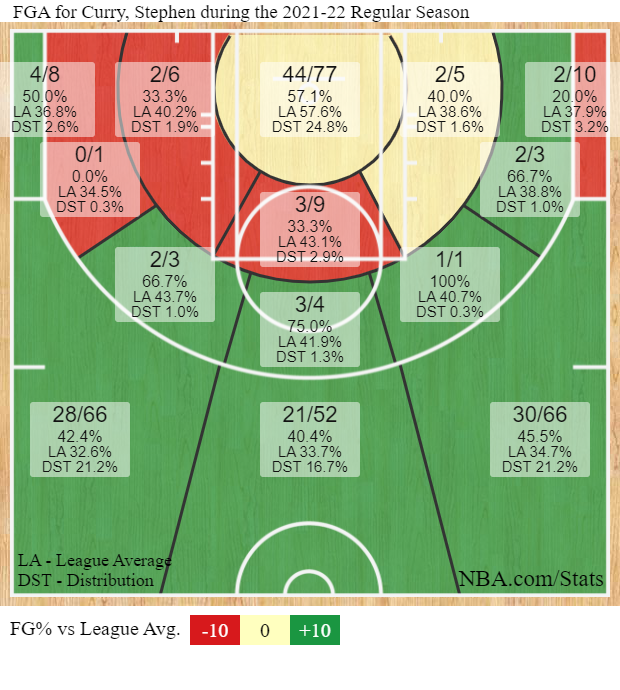
If you aren’t familiar with these zones, previous shot chart (this year’s Steph Curry’s shots) will give you a better picture. In the following text I will use basically the same zones, only the paint is divided with a bit more detail (Restricted area is separate from other paint area). Also zones where the frequency of shots is less than 1% of all shots in either current or past season will not be shown so that the chart isn’t too cluttered.
Dataset
Let’s see exactly how our dataset looks like. Each row consists of frequency of the shots in the zones depicted in the shot chart above (along with that extra Restricted Area zone).

In the previous figure/table you can see what this data looks like on the example of Anthony Davis. The second, third and fourth columns together mark one of the zones in the picture above and then we have a column (TOTAL_SHOTS_LAST) that shows us how many shots he took last season and frequency per zone (ZONE_FREQ_LAST) for last season. We have the same columns for the current season with suffix _CUR.
We have the data arranged in this way for each player.
Determining similarity
There are a lot of similarity metrics, but one of the simplest and most suitable for this task is cosine similarity. I’ll give a brief explanation of cosine similarity, but feel free to move on to the next chapter if you are familiar with cosine similarity (or you hate math). Cosine similarity is a simple measure between two vectors that measures the angle between these two vectors, and the formula itself reads as follows:

In our case, vectors A and B are the shares of shots by individual zones of a player (columns ZONE_FREQ_LAST and ZONE_FREQ_CUR). And we simply multiply each zone from last season by the current one (also called: dot product) and divide by the product of the norms of individual vectors.
Now back to basketball.
Results
It’s time to see who changed their “shot profile” the most. In the following table you can see the 20 players who changed the style the most compared to last season (the lower COSINE_SIMILARITY, the more significant the change in style).

The top 20 players in various profiles shoot this season At the top of the tables we have two excellent shooters, Doug McDermott and Carmelo Anthony, so let’s take a look at how their choice of shots has changed.
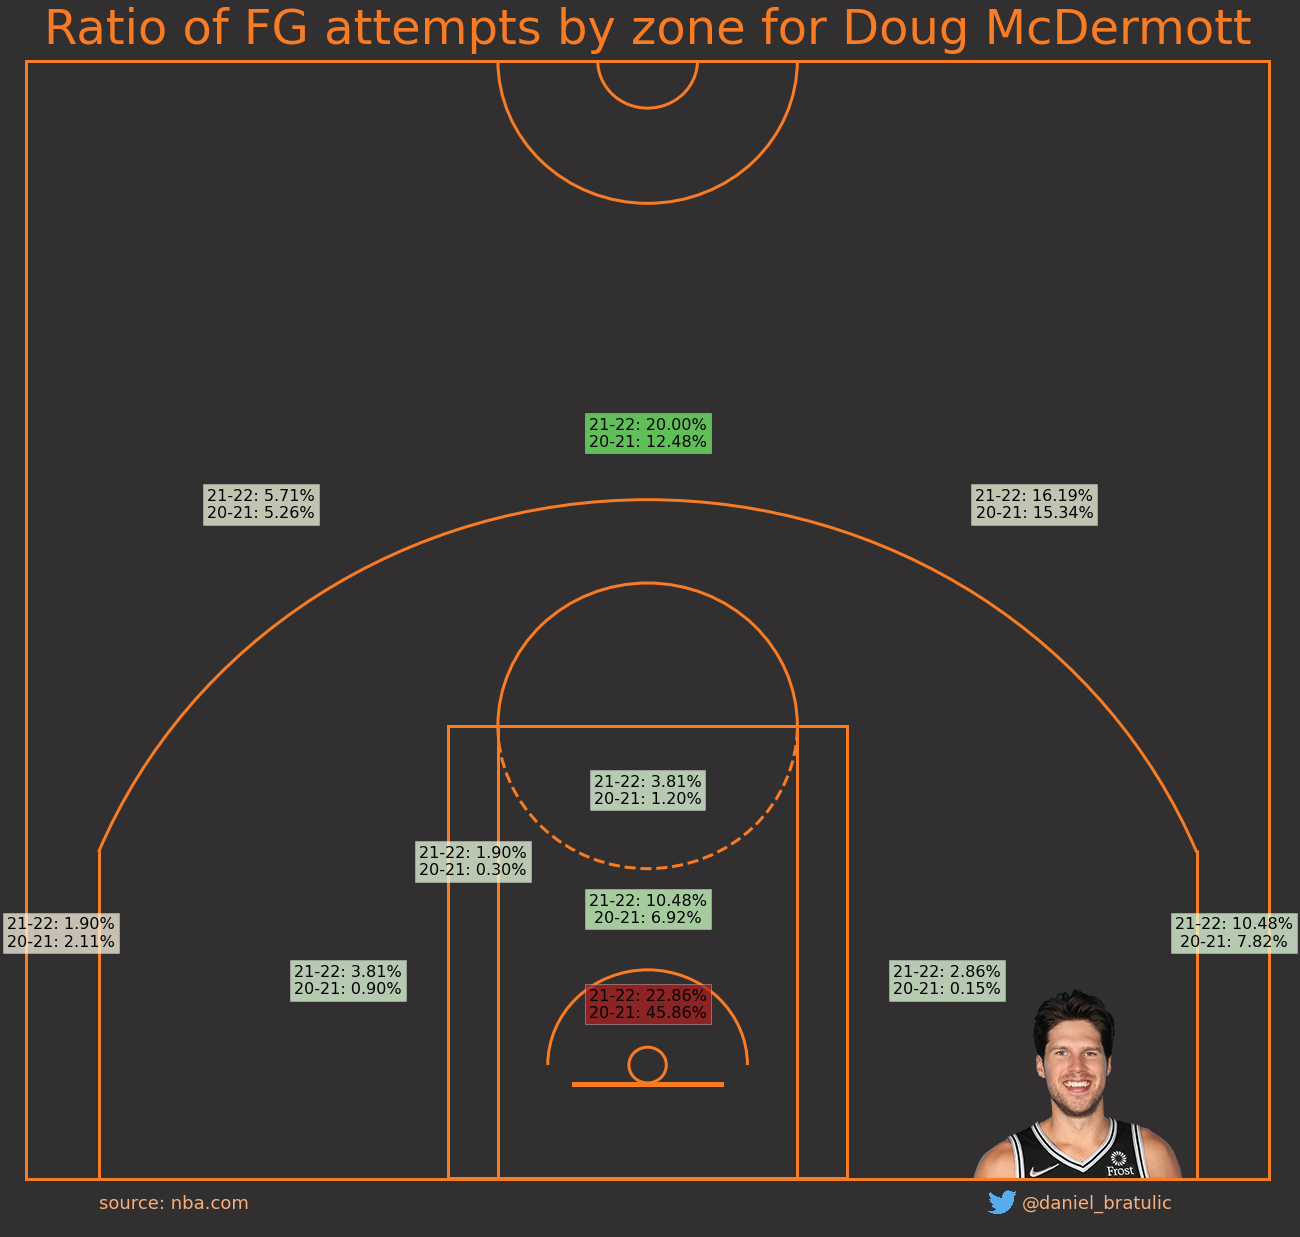
McDermott has turned into an exclusively Catch & Shoot player this year (he has been that for the most of his career, but this season it is emphasized more than before). As many as 93% of all his made shots have been assisted, which is even higher than an high 84% from the last season. This year he stopped driving to the hoop (there is a significant drop in attempts in RA) and he takes a huge amount of triples.
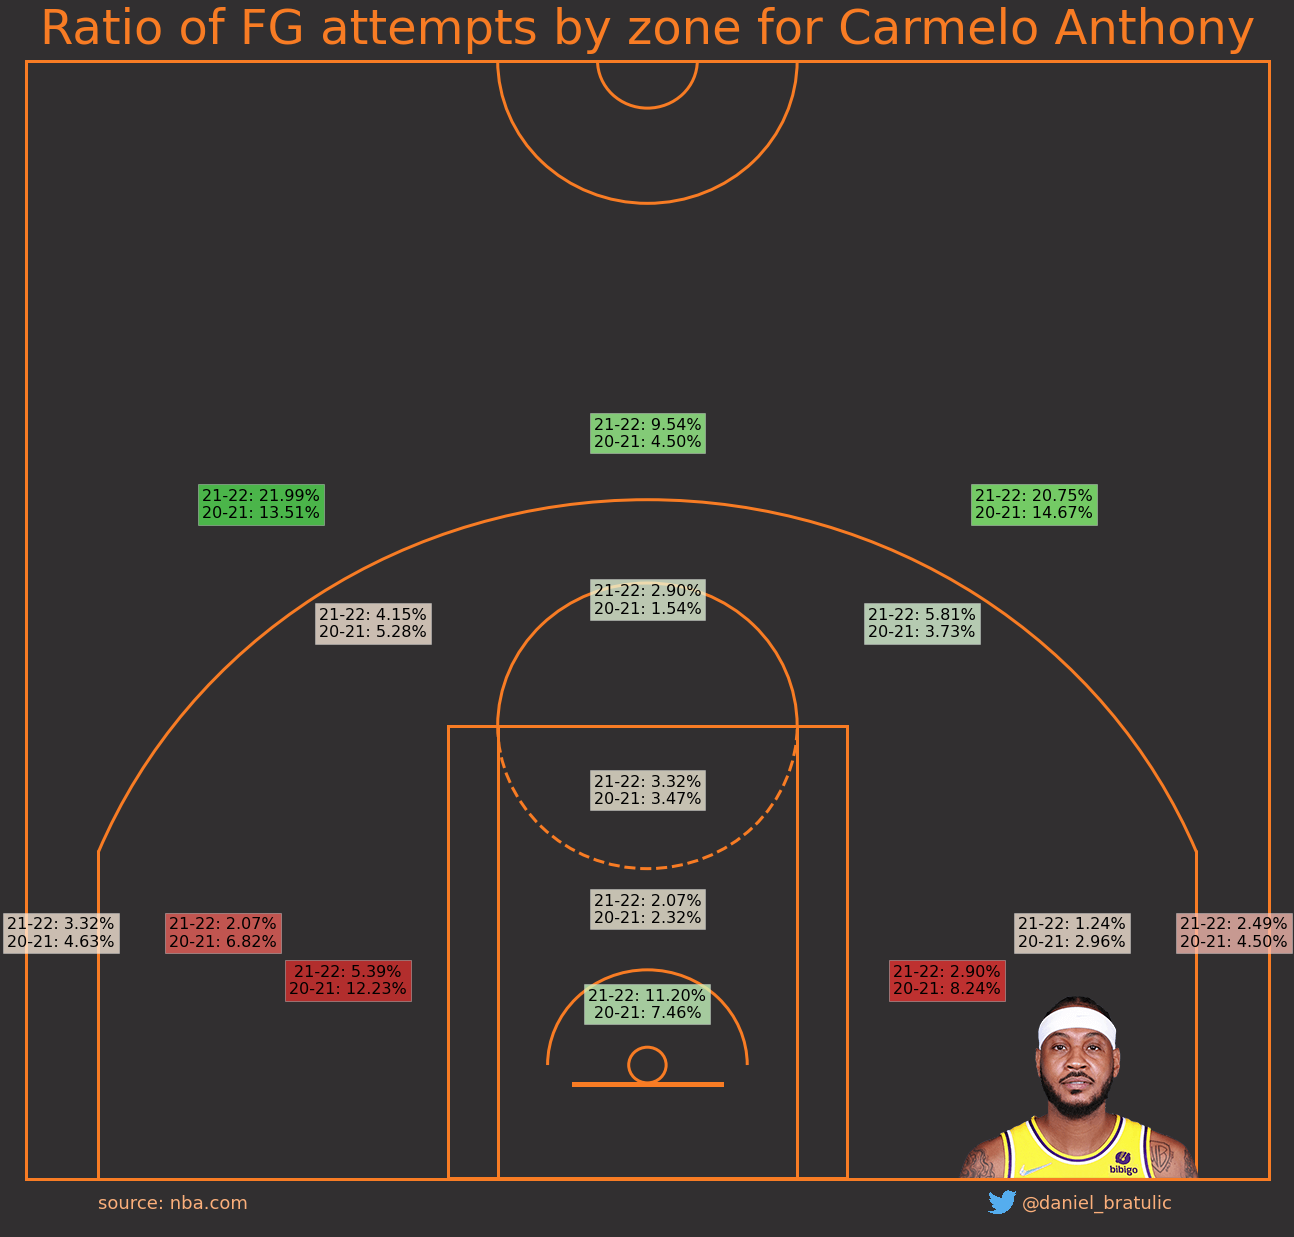
The second place goes to Carmelo Anthony. Melo has basically removed his signature mid-range shots this season and has almost completely moved behind 3 point line. He shoots the most threes per game in his entire career and he does that at an all-time (for him) efficient 43.9% behind the arc. 55% of all shots this season came from C&S situations, which is practically doubled compared to last season in the Blazers’ jersey. He has smaller role than earlier in his career, but that shouldn’t be looked at in a negative way because if Melo continues to play and shoot this way he can extend his career for at least 2 more seasons (in my opinion).
In the previous table we have a few more very interesting names, currently the most prominent are certainly Russell Westbrook, Luka Dončić and Devin Booker. There’s also Embiid, but he missed out on a lot of games so we’ll exclude him (I’m super glad he’s back though, nice to see him on the court).
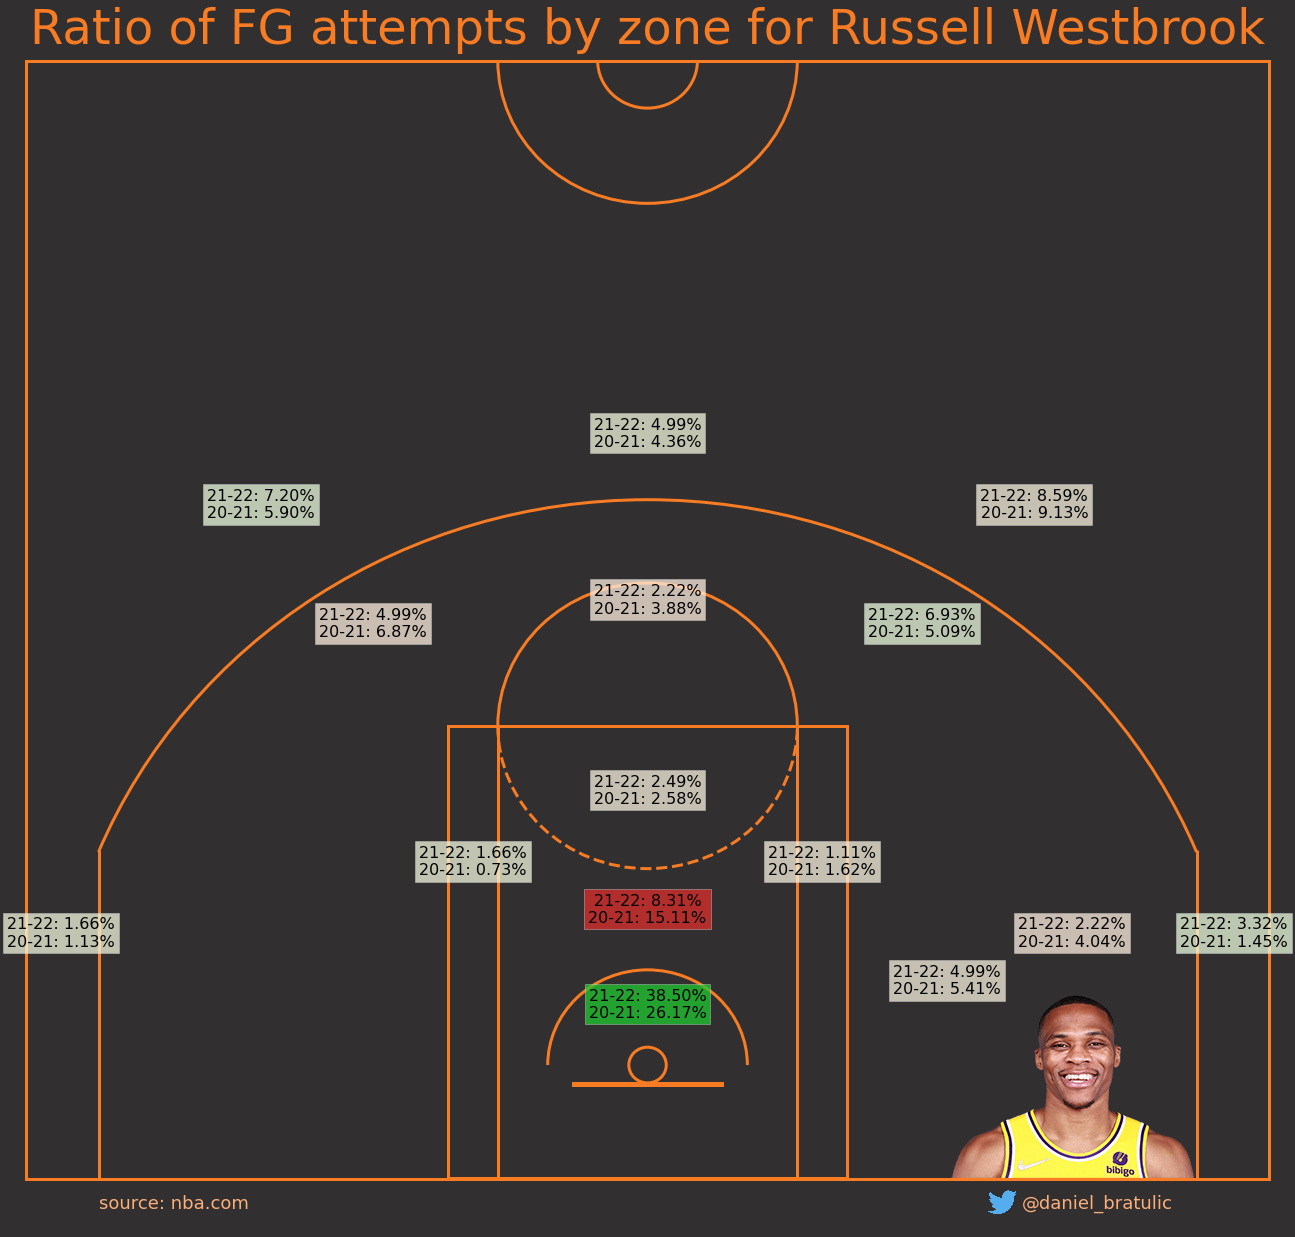
Contrary to the popular belief , Westbrook doesn’t take a lot of shots outside of the paint this season, as it was last season while he was with Wizards, where it just seems like he couldn’t drive to the hoop. Moreover, in these last 4-5 games since LeBron returned, Westbrook is attacking the hoop even more than when LeBron was injured. Here we can see glimpses of that old Russ from OKC and even Houston when he attacked the hoop a lot. The bad news is that he realizes only 55% of all shots in the RA which is the worst percentage for him since the 2014-15 season. But the Lakers’ attack isn’t that much of a problem (especially when LeBron is on the floor), their problem this season is their desperate defense (but that’s another topic)…
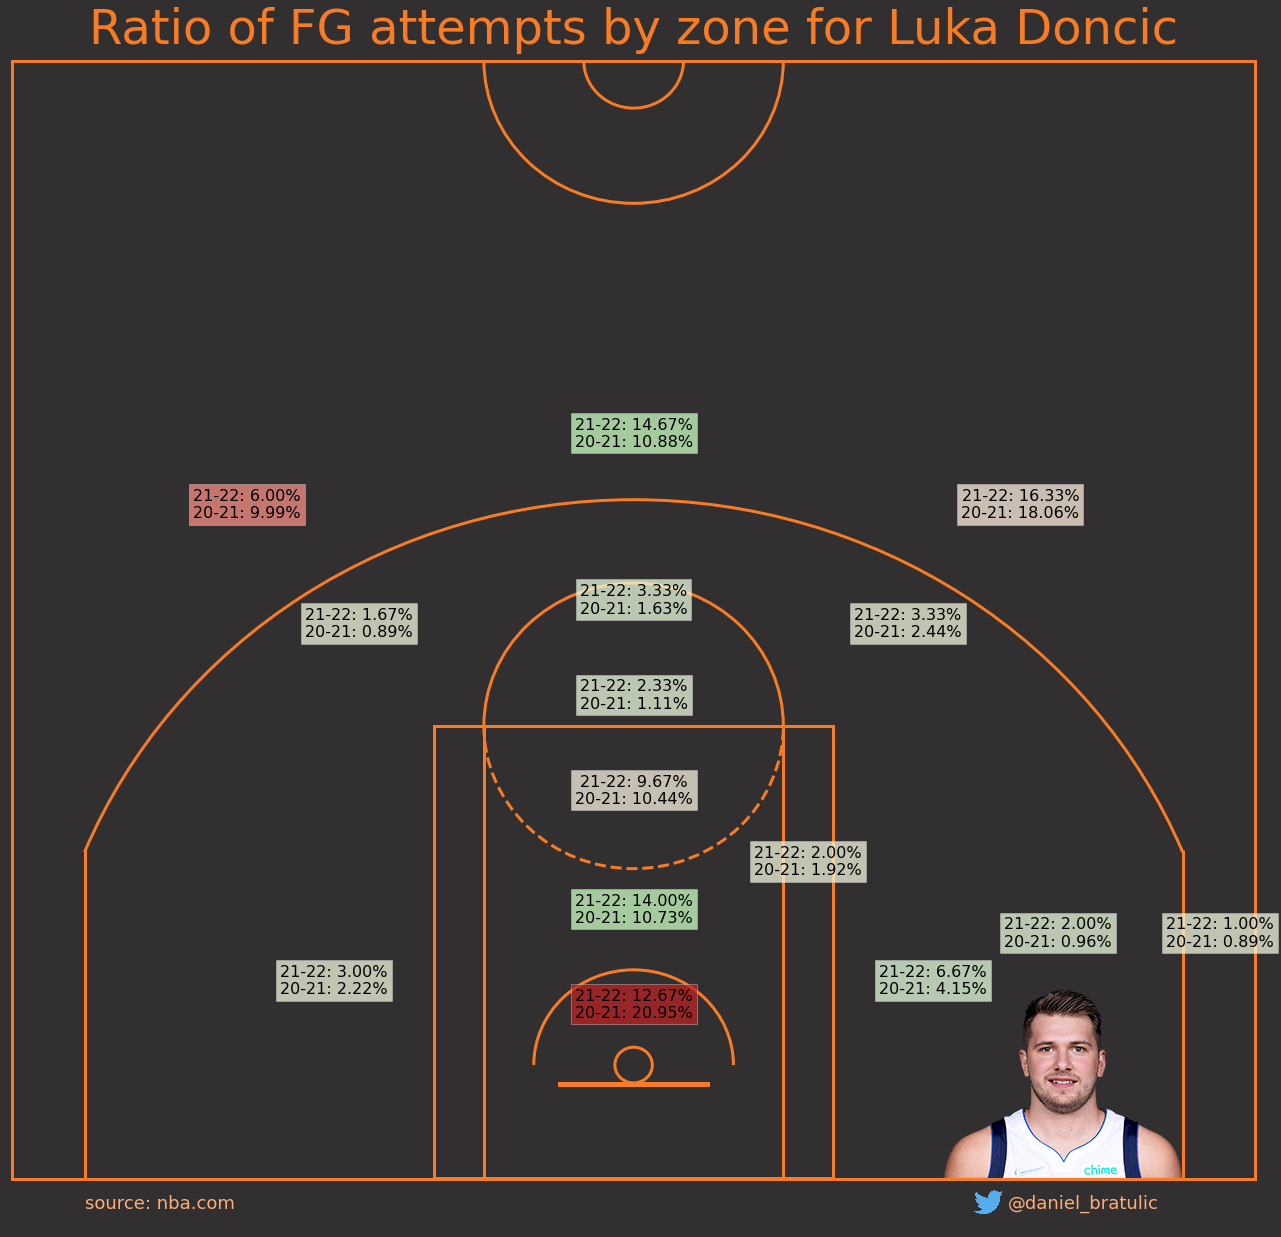
Dončić experienced the “opposite” change compared to Westbrook, meaning that he significantly reduced the number of attempts in the RA which got evenly distributed to other zones. Still the most dominant zone is the left above-the-break 3 pointer from where he has already scored a couple of buzzer beaters.
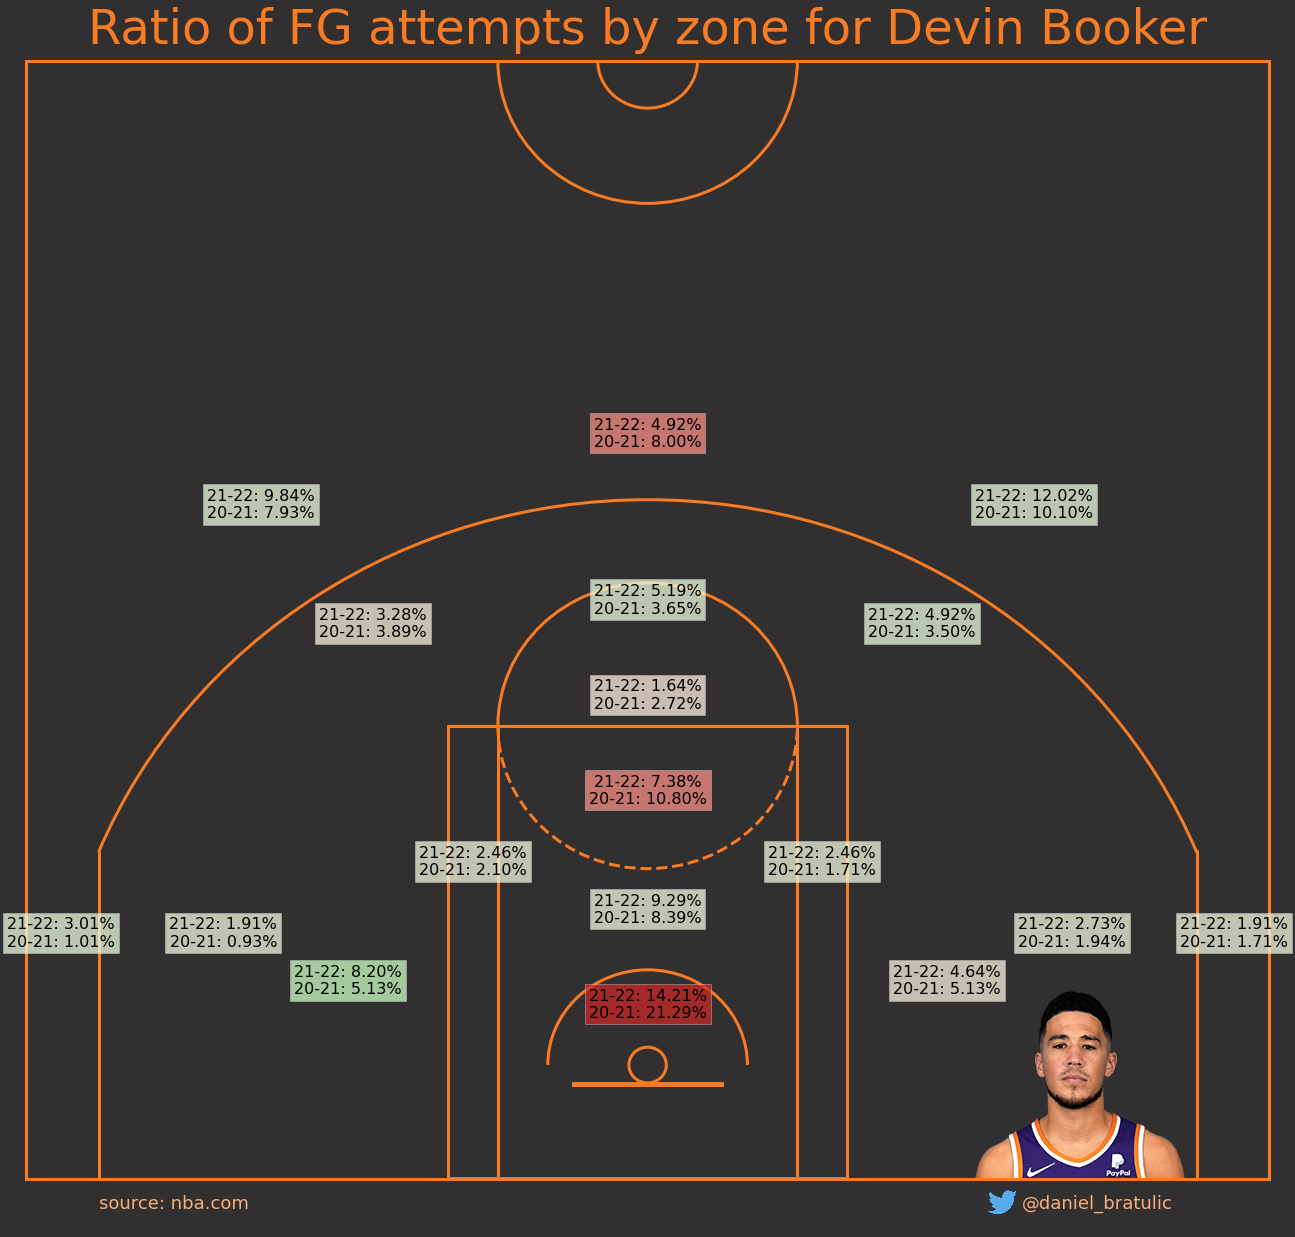
Devin Booker also significantly reduced the amount of shots in the restricted area. It seems that a huge factor in reducing the number of shots on the hoop is also the regulation of non-basketball moves. Ben Taylor talked about this in one his recent videos. In fact, a very large number of guards struggle with driving to the rim and it seems that the percentages around the rim have gone down at the league-wide level.
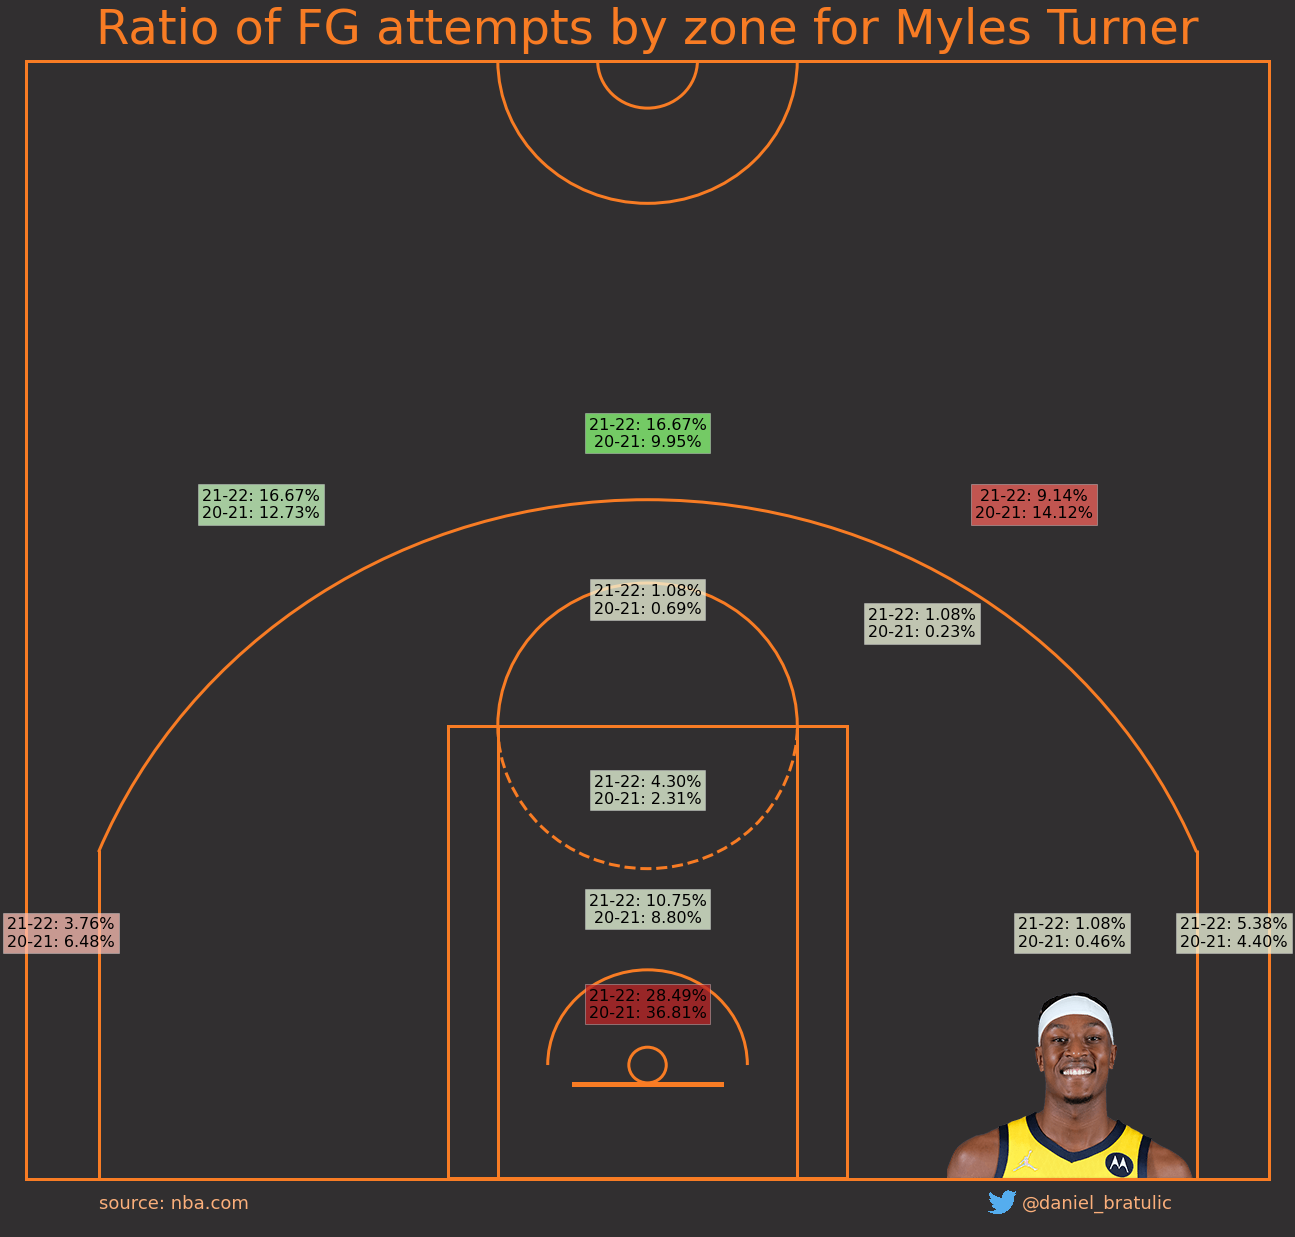
For the end, we have two big men. The first one is Myles Turner. Turner takes a total of 8.9 shots per game, and 4.6 of those shots are threes - turning Turner (hehe) into an ideal stretch big man, who is also an amazing defender, as we all know. He’s leading the league in blocks per game again this season. He converts those 3 point shots at a super efficient 40%.
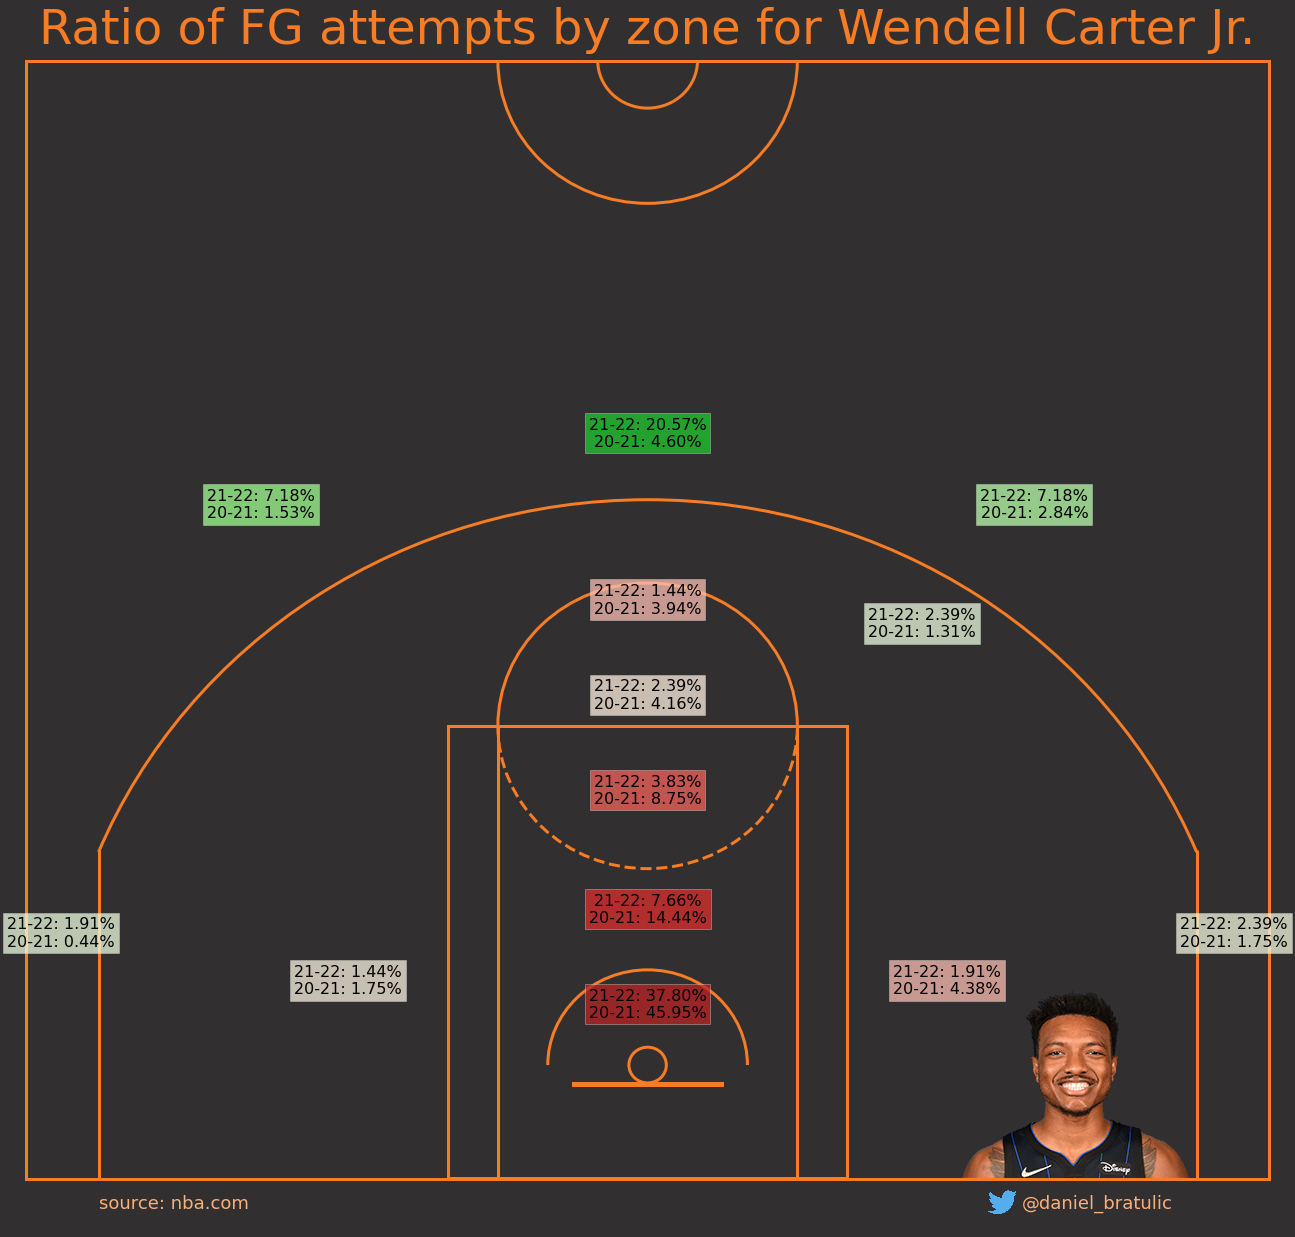
The other big man is Wendell Carter Jr., who this year jumped from 1.3 three-pointers per game to a career high 3.9 per game, but more importantly, he’s shooting them very efficiently at 39%. WCJ is currently playing the best season of its career.
Conclusion
In this post we went through a couple of few players who changed their style the most this season. Although this is a very simple method, which takes into account only the positions of the shots, not the action which led to the shot (whether it was a pull up, catch & shoot, drive,…), but I’ll try to touch on that in a new post :)